Debugging React code
In order to debug React code, you must first install the ClearScript engine. This can be done in the React > Quick Start window, or running the following command in your Unity project root:
npx openupm-cli add com.reactunity.clearscript
Then, in the inspector window, you must choose engine type as ClearScript and select an appropriate debug mode.
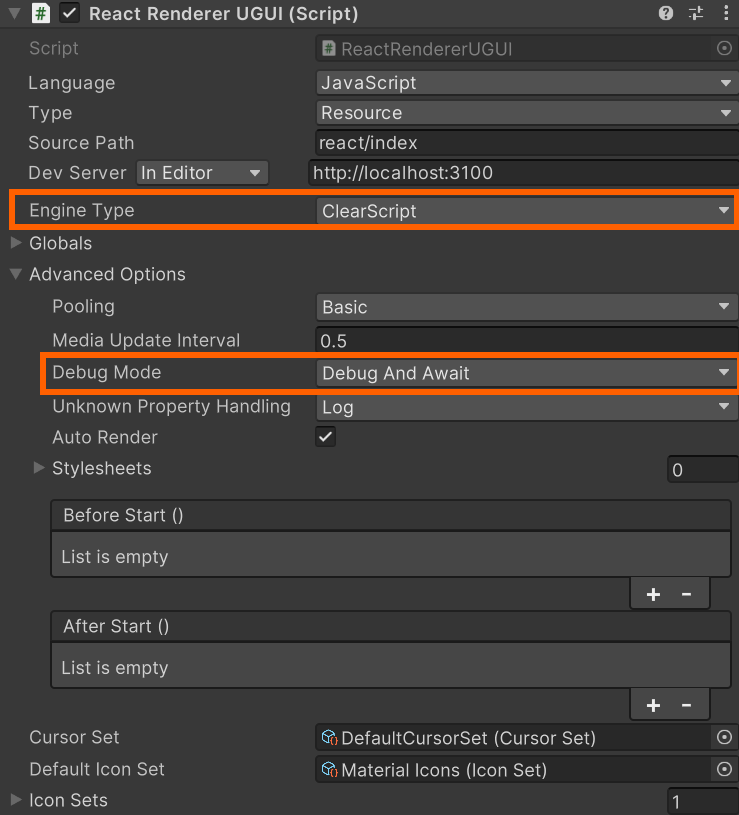
There are 3 debug modes you can choose from:
None: ClearScript will run the code normally and won’t allow it to be debugged.Debug: ClearScript will run the code with debugger and allow a debugger to connect anytime.DebugAndAwait: In addition to running code with debugger, ClearScript will freeze the program and wait for a debugger to connect. If a debugger is not connected within 10 seconds, ClearScript will abort the debugging process and continue to run normally. Note that this option will freeze the Unity Editor for at least 10 seconds if you don’t connect a debugger.
Now, when you run your UI code, ClearScript will start the debugger in 9222 port. You can connect to this debugger in VSCode. Your VSCode launch configuration can be like:
{
  "name": "Attach to ClearScript on port 9222",
  "type": "node",
  "port": 9222,
  "request": "attach",
  "pauseForSourceMap": true,
  "resolveSourceMapLocations": null,
  "skipFiles": [
    "<node_internals>/**",
    "node_modules/**"
  ]
}
Here is a sample launch.json file. Note that VSCode may not resolve sourcemaps correctly without the resolveSourceMapLocations line.
Now, you can add breakpoints in your source code and start debugging.